
By Bob Rudis (@hrbrmstr)
Thu 02 July 2015
|
tags:
blog,
r,
rstats,
survey,
vis,
datavis,
-- (permalink)
It seems that not a day goes by without some information security vendor releasing a report based on a survey. Thankfully, this post is not about the efficacy of survey-based reports or their findings. Today, we’re doing a makeover for Unisys, who just released their Findings from the 2015 ...
By Bob Rudis (@hrbrmstr)
Thu 14 May 2015
|
tags:
blog,
excel,
datavis,
-- (permalink)
I saw some chatter about a post on spam and new gTLDs on Kasperky’s SecureList and initally got excited that there might be actual data to look at since our work-team started looking at this very topic last year but got distracted by the 2015 DBIR work (we’re ...
By Bob Rudis (@hrbrmstr)
Thu 30 October 2014
|
tags:
datavis,
d3,
security,
-- (permalink)
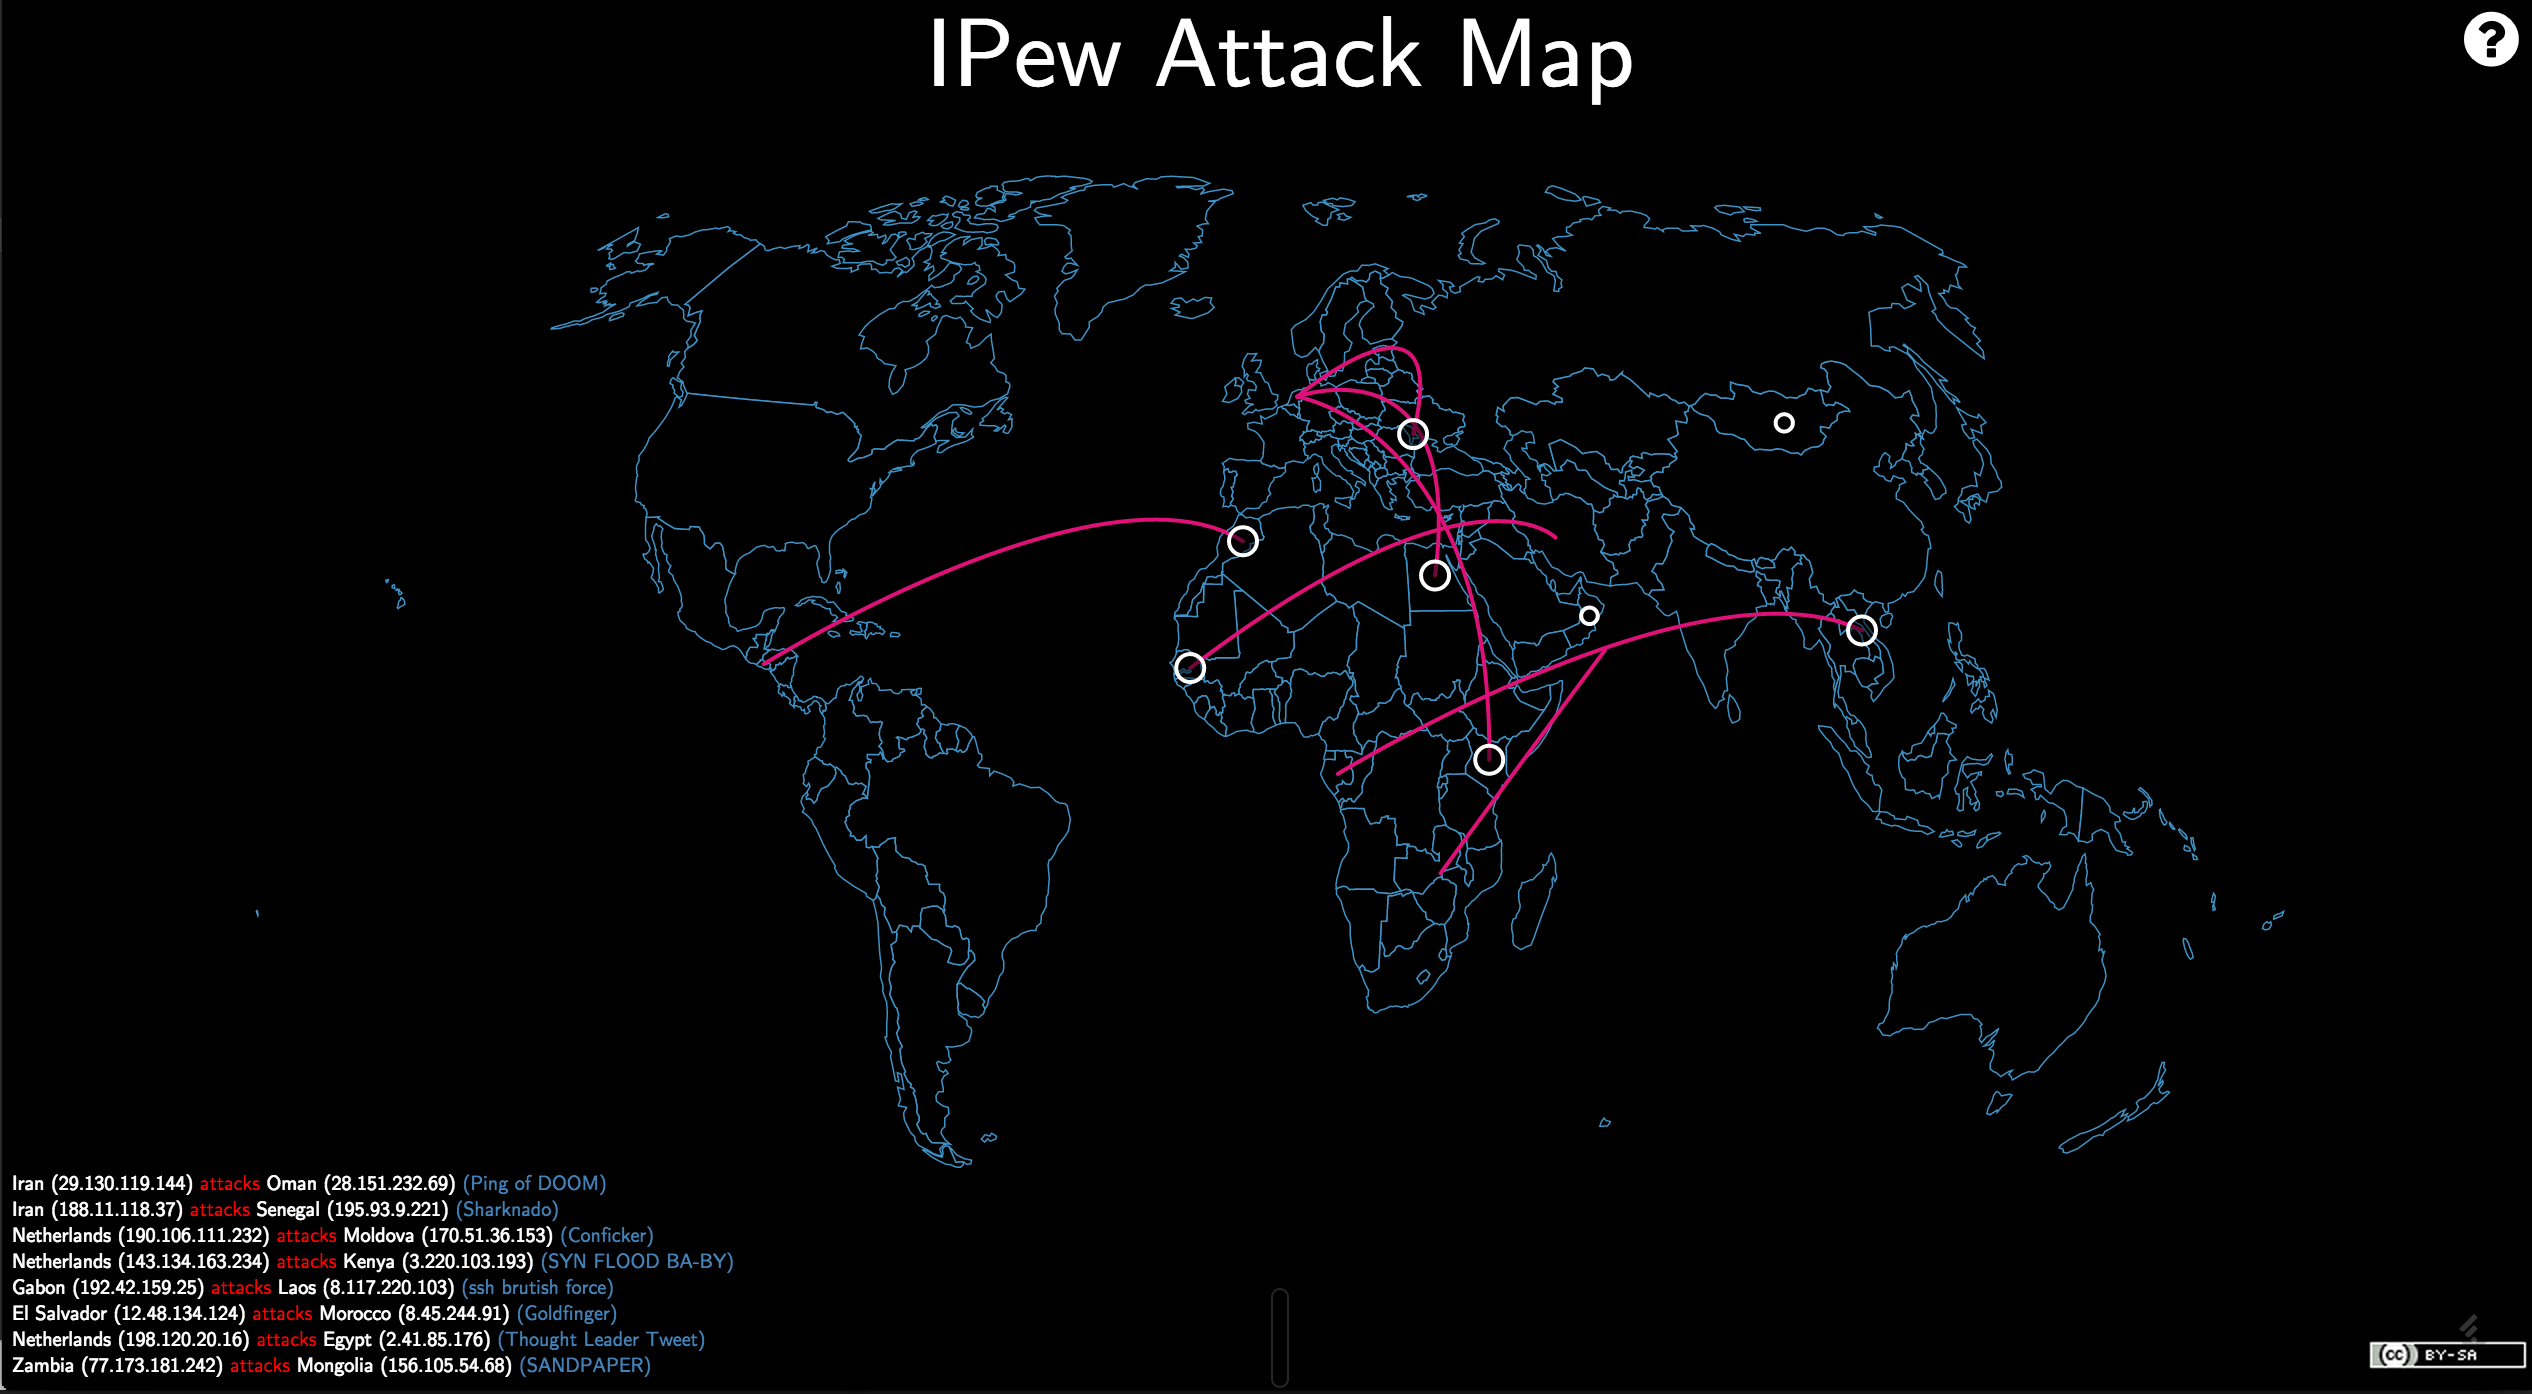
Are you:
- A security vendor feeling inadequate because you don’t have your own “live attack graph”?
- A SOC manager who needs to distract/impress visitors and/or executives with an “ooh, shiny!” display?
- A researcher who wants to draw attention to your project but just don’t have the ...
By Bob Rudis (@hrbrmstr)
Wed 29 October 2014
|
tags:
survey,
datavis,
r,
rstats,
rstat,
-- (permalink)
Gallup released the results of their annual “Crime” poll in their Social Poll series this week and spent much time highlighting the fact that “cyber” was at the top of the list.

(There’s nary a visualization on the Gallup post or in the accompanying PDF, so keep that graphic ...
By Bob Rudis (@hrbrmstr)
Wed 02 July 2014
|
tags:
datavis,
geoip,
-- (permalink)
The ever-watchful @cdporter00 pointed out the use of an IP-space density map in Microsoft’s recent court filing [PDF] related to the somewhat controversial takedown of a boatload of domains:
Defendants Mutairi, Benabdellah, and Does 1-500 (“Malware Defendants”) have directed actions at Nevada, including the division of Las Vegas ...
By Bob Rudis (@hrbrmstr)
Fri 13 June 2014
|
tags:
rstats,
r,
datavis,
wifi,
cartography,
maps,
RCurl,
-- (permalink)
This is the second of a two-part series. Part 1 set up the story and goes into how to discover, digest & reformat the necessary data. This concluding segment will show how to perform some basic visualizations and then how to build beautiful & informative density maps from the data and offer ...
By Steve Patton (@spttnnh)
Mon 09 June 2014
|
tags:
datavis,
dataviz,
AlienVault,
data analysis. data management,
r,
rstats,
-- (permalink)
In Part 1 we looked at acquiring raw data, and wrangling it into a time series dataset. In Part 2 we looked at types of threats in the time series. In Part 3 we looked at countries. Now we will examine countries and types in combination in the AlienVault reputation ...
By Bob Rudis (@hrbrmstr)
Fri 06 June 2014
|
tags:
rstats,
r,
datavis,
wifi,
cartography,
maps,
RCurl,
-- (permalink)
This is the first of a two-part series. Part 1 sets up the story and goes into how to discover, digest & reformat the necessary data. Part 2 will show how to perform some basic visualizations and then how to build beautiful & informative density maps from the data and offer some ...
By Bob Rudis (@hrbrmstr)
Sun 20 April 2014
|
tags:
datavis,
hbr,
-- (permalink)
The Harvard Business Review (@HarvardBiz) online magazine* is chock full of great articles, many of which intersect with the notion of creating compelling narratives and/or visualizations with data (two of the premises we talk about frequently in our book). Here are some excellent data-oriented articles there that I felt ...
By Steve Patton (@spttnnh)
Wed 02 April 2014
|
tags:
datavis,
dataviz,
AlienVault,
data analysis. data management,
R,
-- (permalink)
In Part 1 we looked at acquiring raw data, and wrangling it into a time series dataset. In Part 2 we looked at types of threats in the time series. Now we will examine countries in the AlienVault reputation database.
One of the skills a data scientist must develop is ...
Page 1 / 2 »