
By Bob Rudis (@hrbrmstr)
Wed 02 July 2014
|
tags:
datavis,
geoip,
-- (permalink)
The ever-watchful @cdporter00 pointed out the use of an IP-space density map in Microsoft’s recent court filing [PDF] related to the somewhat controversial takedown of a boatload of domains:
Defendants Mutairi, Benabdellah, and Does 1-500 (“Malware Defendants”) have directed actions at Nevada, including the division of Las Vegas, by directing malicious computer code at the computers of individual users located there, and infecting those user computers with the malicious code, which is used to injure Microsoft, its customers and the general public. Microsoft is aware of over 1,200 computers in Las Vegas alone that have encountered the Defendants’ malware. With this malware, Defendants are able to steal login credentials, such as user names and passwords, from victims’ computers, and set up networks of computers that are under their control. The following is a map showing the concentration of these computers in Nevada, which shows the predominant area of infections occurring in Las Vegas.
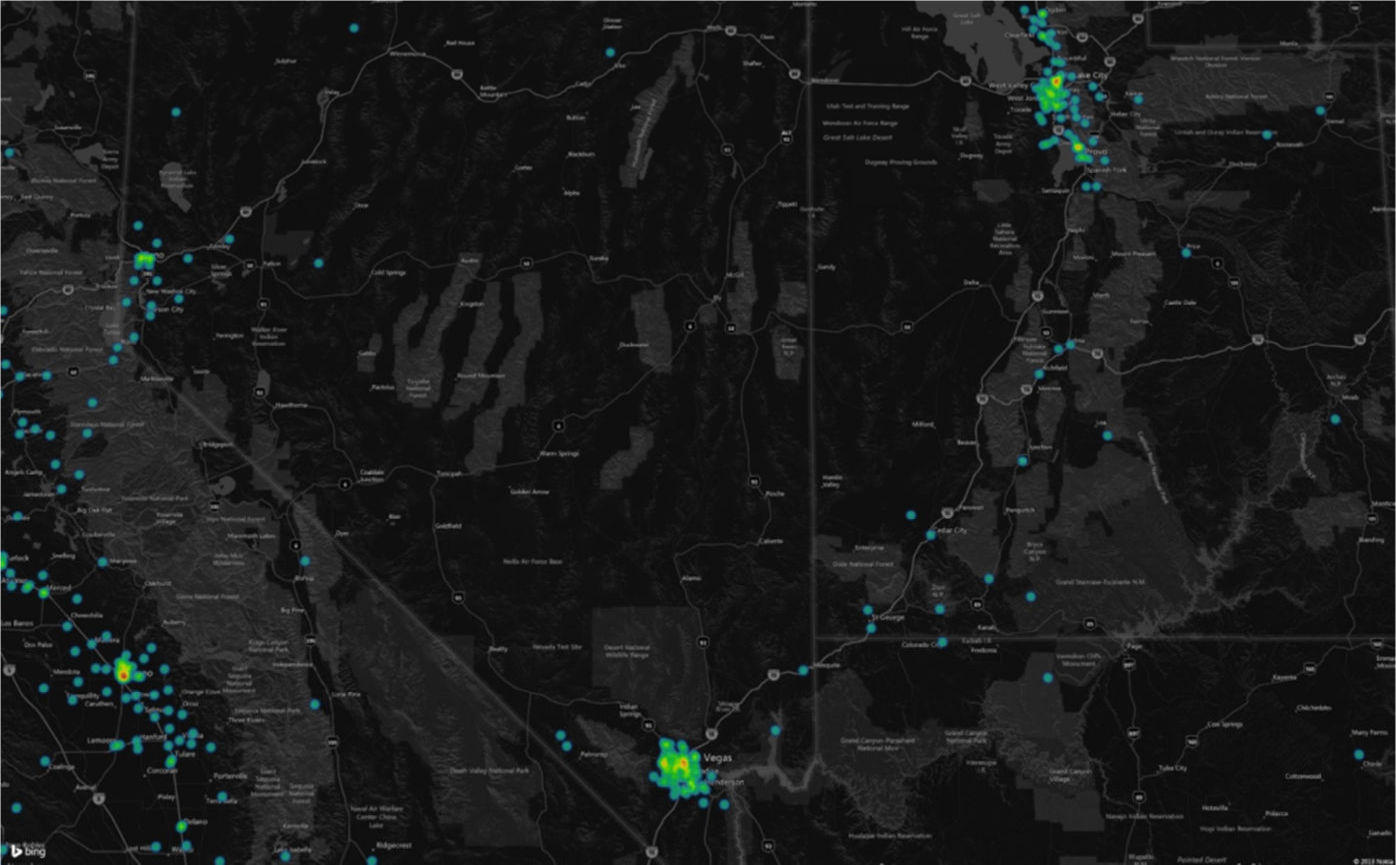
We recently covered density plots (or geographic heat maps) using R, but the one from Microsoft definitely looks like Microsoft used their Power View feature in Excel 2013 to make the artifact for the filing.
While I appreciate the use of modern tools and new visualization techniques—especially in a setting that is often playing catch-up to technological and design improvements—the pattern on the map should come as no surprise to DDS readers since it look like it just tracks with population density. Sneaky, but (apparently) effective.
The map (most likely) did help Microsoft make their case, which should further underscore how important it is to communicate your message in the most effective way possible. We’ve listed many open source and commercial resources that can help you make the most of your own (and, hopefully, less controversial) messages.
Tweet