By Bob Rudis (@hrbrmstr)
Sat 24 January 2015
|
tags:
blog,
rstats,
r,
shiny,
dashboard,
-- (permalink)
Jay & I cover dashboards in Chapter 10 of Data-Driven Security (the book) but have barely mentioned them on the blog. That’s about to change with a new series on building dashboards using the all-new shinydashboard framework developed by RStudio. While we won’t duplicate the full content from the book, we will show different types of dashboards along with the R code used to generate them.
Why R/Shiny/shinydashboard?
You can make dashboards in a cadre of programs: from Excel to PowerPoint, Tableau to MicroStrategy (a tool of choice for the “Godfather of Dashboards” - Stephen Few), Python to Ruby, plus many canned Saas tools. shinydashboards is compelling since it:
- is completely free (unless you need or are compelled to purchase commerical support options)
- provides substantial functionality and layout options out-of-the-box
- facilitates connectivity with diverse dynamic data sources, including “big data” systems
It also enables the use of every data gathering, data munging, statistical, computational, visualization & machine-learning package R has to offer to help make your dashboards as meaningful, accurate and appealing as possible.
The shinydashboard framework is also pretty easy to wrap your head around once you dive into it. So, let’s do so right now!
Prerequisites
You’ll obviously need R, and we also recommend RStudio, especially since it has great support for developing Shiny apps.
You’ll also need the shiny and shinydashboard packages installed:
install.packages(c("devtools", "shiny"))
devtools::install_github("rstudio/shinydashboard")
We also make liberal use of the “hadleyverse” (the plethora of modern R packages created by Hadley Wickham). These include dplyr, tidyr, httr, rvest and others. Install them as you see them used/need them.
The Basic shinydashboard Framework
Shinydashboard runs on top of Shiny, and Shiny is an R package that presents a web front-end to back-end R processing. All Shiny apps define user-facing components (usually in a file called ui.R) and server-side processing components (usually in a file called server.R) and use reactive expressions to tie user actions (or timed triggers) to server events (or have server-side events change the user-interface). Shiny applications present themselves in a Bootstrap 3 template and the shinydashboard package adds a further layer of abstraction, making it fairly simple to embed complex controls and visualizations without knowing (virtually) any HTML.
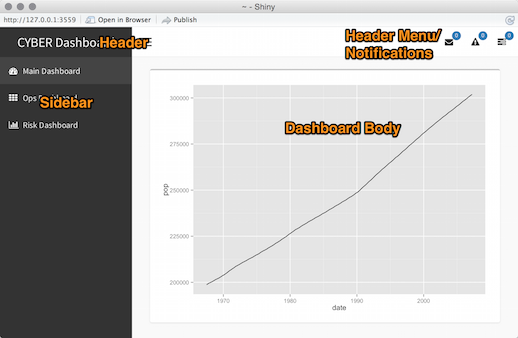
When building shinydashboards, you work with:
- header components (titles, notificaitons, tasks & messages)
- sidebar components (menus, links, input components)
- main dashboard body (composed of “boxes”)

The following is the R version of that structure in a single-file shinydashboard app (app.R) without any extra components:
library(shiny)
library(shinydashboard)

# Simple header -----------------------------------------------------------

header <- dashboardHeader(title="CYBER Dashboard")

# No sidebar --------------------------------------------------------------

sidebar <- dashboardSidebar()

# Compose dashboard body --------------------------------------------------

body <- dashboardBody(
  fluidPage(
    fluidRow()
  )
)

# Setup Shiny app UI components -------------------------------------------

ui <- dashboardPage(header, sidebar, body, skin="black")

# Setup Shiny app back-end components -------------------------------------

server <- function(input, output) { }

# Render Shiny app --------------------------------------------------------

shinyApp(ui, server)
If you’re wondering what’s up with the long “
# xyz ---” comments, RStudio will use them to provide block entries in the source code function navigation menu, making it really easy to find sections of code quite quickly.
Paste that into an RStudio file pane and source (run) it to see how it works (we’ll cover using it in the context of a Shiny server environment in another post).
Building a ‘Con’ Board
We infosec folk seem to really like “Con” (“current threat level”) gauges. We’ve got the SANS ISC “Infocon”, Symantec’s “ThreatCon” and IBM X-Force’s “AlertCon” (to name just a few). Let’s build a dashboard that grabs the current “Con” status from each of those three places and puts them all into one place.
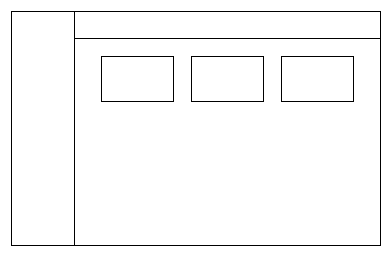
It’s always good to start with a wireframe layout for your dashboard (even though this is a pretty trivial one). Let’s have one row of shinydashboard valueBoxes:

which will normalize the look & feel of the alerts, and make a tap/select on each box take the user to the actual alert site for more details.
Since we’re going to be parsing JSON and HTML from various places, we’ll be making liberal use of the hadleyverse and some other packages:
library(shiny)
library(shinydashboard)
library(httr)
library(jsonlite)
library(data.table)
library(dplyr)
library(rvest)
library(magrittr)
The initial setup code looks the same as the basic example above, but it adds some elements to the fluidRow to give us places for our status boxes:
header <- dashboardHeader(title="CYBER Dashboard")

sidebar <- dashboardSidebar()

body <- dashboardBody(
  fluidPage(
    fluidRow(
      a(href="https://isc.sans.org/",
        target="_blank", uiOutput("infocon")),
      a(href="https://www.symantec.com/security_response/threatcon/",
        target="_blank", uiOutput("threatcon")),
      a(href="https://webapp.iss.net/gtoc/",
        target="_blank", uiOutput("alertcon"))
    )
  )
)

ui <- dashboardPage(header, sidebar, body, skin="black")
Now, in the server function, we have three sections, each performing data gathering, extraction and placement in the valueBoxes. We start with the easiest, the SANS ISC Infocon:
server <- function(input, output) {

  output$infocon <- renderUI({

    infocon_url <- "https://isc.sans.edu/api/infocon?json"
    infocon <- fromJSON(content(GET(infocon_url)))

    valueBox(
      value="Yellow",
      subtitle="SANS Infocon",
      icon=icon("bullseye"),
      color=ifelse(infocon$status=="test", "blue", infocon$status)
    )

  })
The output$infocon is tied to the uiOutput("infocon") in the dashboardBody and the setup code grabs the JSON from the DSheild API and ensures the right color and label is used for the valueBox (I’m not entirely thrilled with the built-in color choices, but they can be customzed through CSS settings and we’ll cover that in a later post, too).
The remaning two section require finding the right HTML tags and extracting the con status from it, then tying the level to the right color. I use both CSS & XPath selectors in the following examples just to show how flexible the rvest package is (and I am a recovering XML/XSLT/XPath user):
  output$threatcon <- renderUI({

    pg <- html("https://www.symantec.com/security_response/#")
    pg %>%
      html_nodes("div.colContentThreatCon > a") %>%
      html_text() %>%
      extract(1) -> threatcon_text

    tcon_map <- c("green", "yellow", "orange", "red")
    names(tcon_map) <- c("Level 1", "Level 2", "Level 3", "Level 4")
    threatcon_color <- unname(tcon_map[gsub(":.*$", "", threatcon_text)])

    threatcon_text <- gsub("^.*:", "", threatcon_text)

    valueBox(
      value=threatcon_text,
      subtitle="Symantec ThreatCon",
      icon=icon("tachometer"),
      color=threatcon_color
    )

  })

  output$alertcon <- renderUI({

    pg <- html("https://xforce.iss.net/")
    pg %>%
      html_nodes(xpath="//td[@class='newsevents']/p") %>%
      html_text() %>%
      gsub(" -.*$", "", .) -> alertcon_text

    acon_map <- c("green", "blue", "yellow", "red")
    names(acon_map) <- c("AlertCon 1", "AlertCon 2", "AlertCon 3", "AlertCon 4")
    alertcon_color <- unname(acon_map[alertcon_text])

    valueBox(
      value=alertcon_text,
      subtitle="IBM X-Force",
      icon=icon("warning"),
      color=alertcon_color
    )

  })

}

shinyApp(ui, server)
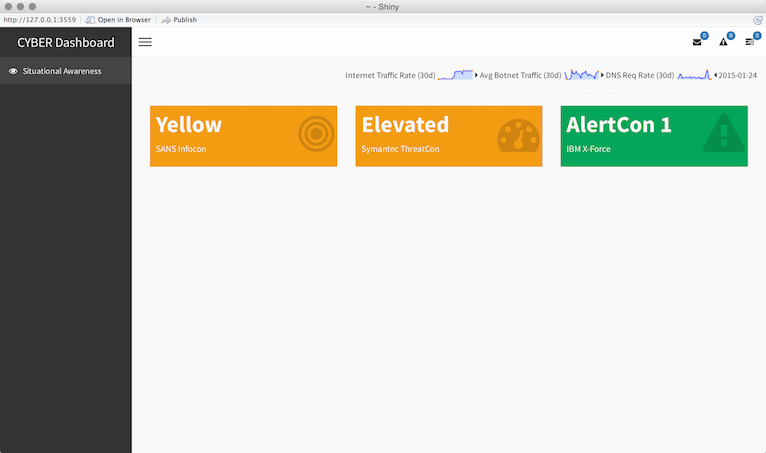
The result is a consistent themed set of internet situational awareness at a high level:

OK, I snuck some extra elements in on that screen capture, mostly as a hint of things to come. The core elements - the three “con” status boxes are unchanged from the simple example presented here.
You can find the code for the dashboard in this gist and you can even take a quick view of it (provided you’ve got the required packages installed) via shiny::runGist("e9e941ad4e3568f98faf"). As a general rule, I advise either running code locally (after inspection) or carefully examining the remote code first before blindly running foreign URLs. This is the R equivalent of curl https://example.com/script.sh | sh, which is also a bad practice (unless it’s your own code).
Next Steps
The dashboard in this post loads all the data dynamically, but only once. In the next post, we’ll show you how to incorporate more data elements, incorporate dynamic updating capabilities and also add some other sections to the dashboard, including sidebar menus and header notifications.
Tweet