
By Bob Rudis (@hrbrmstr)
Sat 25 January 2014
|
tags:
data science,
podcast,
-- (permalink)
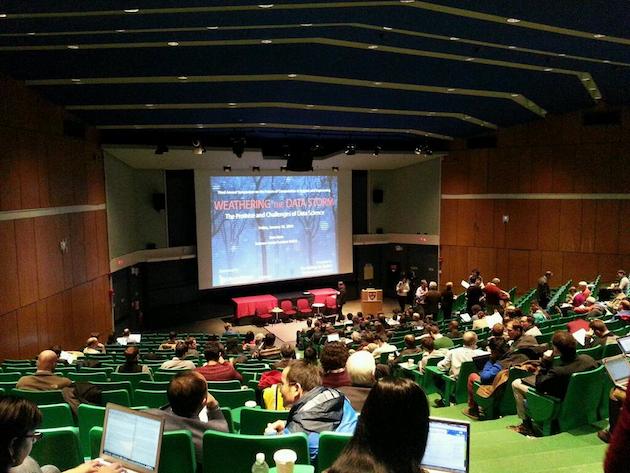 I had the opportunity to attend Weathering the Data Storm: The Promise and Challenges of Data Science at Harvard yesterday (2013-01-24). Overall, it was an excellent symposium and I’ll be talking with Jay about it on the next podcast.
The @DDSecBlog account was live-tweeting as much as possible and I’ve hoovered them all up and put them below. So, while you’re waiting for the podcast you can peruse the tweets to see i there are 140 character nuggets worth bookmarking.
Weathering the Data Storm: The Promise and Challenges of Data Science Tweetscription
| Rachel Schutt starting her talk on “What is Data Science” @; highlighting “promise” & “challenge” in the symposium’s title “Data Science” subsumes other fields and disciplines; is a moving target; comes with much hype but also much promise |
| Data Science as a job title: great summary of part of “Building Data Science Teams” by @OReillyMedia (buy the book :-) |
| Facebook & LinkedIn started building “data products” (e.g. friend recommendations) from scads of raw user action logs |
| Skill sets are interdisciplinary and team-oriented; “data scientists should think like journalists” |
| Raw material of data products are data and code and is part of a user-centric feedback loop. |
| Underlying analytics can be familiar (e.g. naive bayes) but scale can be challenging esp if real-time. |
| Google didn’t have a job title “data scientist” until 2013. Title rly was born from tech companies. |
| Great re-quotes of Josh Willis and Will Cukierski #googlethem |
| Referencing Cleveland’s spiffy “action plan” from 2001 showing use of the co-joined terms “Data Science” |
| “Data science” process https://t.co/Qv7yu8lvPj” |
| Models developed for data products need to consider the impact on user behavior (cld be causal vs pure predictive) |
| Data science is not just a bunch of academic disciplines glued together, instead it shld come from fields intermingling |
| IPython talk by Fernando Pérez coming up next. it’d rock if it it’s all in an IPython Notebook :-) |
| Despite all the computing resources at our disposal we only have 2 eyeballs & one brain. Need gd flow from raw data to insight |
| lifecycle of a scientific idea: 1. individual, 2. collar, 3. parallel, 4. publication !reproducible!, 5. education, Goto 1 |
| Nice shout out to Enthought (Canopy rocks btw). IPython is a “terminal for a scientist” |
| IPython Notebooks: Everyday exploratory computing with annotations |
| ZOMGosh it’s a live IPython Notebook for the presentation! #awesome |
| IPython Notebooks have full support for rich output (anything a browser can display) and LaTeX & symbolic math support |
| W00t! Showing R integration into IPython “%load_ext rmagic” “%%R” (has Julia, Ruby and other support too) |
| nbconvert can translate IPython Notebooks to HTML, PDF, LaTeX, etc |
| Can also share IPython Notebooks over at https://t.co/j4oCEKMSa1 w/just a link to your ipynb file |
| IPython Notebooks are a huge help to the reproducible research movement |
| Python for Signal Processing is also available as a github repository and is just a collection of IPython Notebooks #spiffy |
| All CS109 homework assignments at Harvard are IPython Notebooks |
| IBM’s Watson case study switched from an clunky in-house custom software setup to IPython. |
| Enthought Canopy, Microsoft Python Tools in Visual Studio & Azure; Anaconda all “talk” IPython |
| MIT has a “StarCluster” capable of running IPython at scale |
| ZOMGOSH! Now answering an audience question about using Perl, SQL & SAS from IPython vs standalone, so he just does it live |
| Next up: Bonnie Ray, Director of Cognitive Algorithms at IBM Watson Research Center: “From Big Data” to Better Decision Making” |
| IBM Watson is involved in many, diverse analytics projects. Featuring their https://t.co/Gd3Sy3Dr9J SMS poll analyses now |
| IBM analyzes unsolicited texts TO the project and auto-classifies them. More info/details here: https://t.co/uiyLikbS8l |
| Now covering a developed hierarchical TCM technique to drill into customer satisfaction data HTCM paper: https://t.co/7mrYdAqbfX |
| Super-stoked for @jeffrey_heer’s Interactive Data Analysis talk (up next) |
| Shout out to Tukey. Many quotes. Great foundation for the talk. |
| “Nothing can substitute for the flexibility of the informed human mind” |
| Showing his Facebook “ego network” in graph viewer as an example of using vis to help direct further modeling/analysis tasks” |
| Switching from node-link to adjacency matrix with seriation, which reveals some additional structure |
| Switches from seriation to ordering by Facebook id, revealing a pattern that was actually caused by a bad FB search query |
| Covering challenges in data acquisition and cleaning and the birth of Data Wrangler https://t.co/J5MF4qY0My |
| How might we support expressive & effective vis design? Showing a D3 version of Playfair’s Wheat Chart |
| Great D3 demo. Can find most of the examples at https://t.co/hE96W8adt5 |
| Now covering the Stanford Dissertation Browser https://t.co/Y2lxSCHyc4 |
| entered late…#sigh…Electricity grid topic on slides. Looking at the extremely messy data in trouble tickets |
| Trouble tickets == “data tombs” (awesome term!). Wrking on Reactive Point Processes to do short horizon or real time prediction” |
| Great paper to read explaining the MHE talk in more detail: https://t.co/hnqU9WmX7l |
| New topic: next gen search engine finds what you need before you need it. |
| Using a “Boston events” and “Jewish foods” search examples. Comparing Google Sets vs Boo!Wa! results” |
| Paper explaining the “search” experiment: https://t.co/A681W7toNh” |
| When developing models do you need to sacrifice interpretability for accuracy? #datascience14 |
| Assoc rules & Assoc classification. Step 1: Find (alot of) Rules -> Step 2: Order rules to build a list. |
| Goal: classification; Probabilistic model of permutations; Use Bayesian prior to gain interpretability; |
| Goal: Measure stroke risk among patients with atrial fib (and beat CHADS2). Started with 11.1m Medicaid enrollees… |
| Used criteria to filter down to 12.5. Developed rly straightforward set of rules to identify stroke risk %. |
| Google’s up now. “Statistics at Google scale”. |
| Big ideas from the masters: Collect data carefully; Experiment; Measure uncertainty & bias; Monitor all the time |
| Stats are the core of google search. Talking about historical Page rank. |
| google has a lot of data. From users (across products). Logs (queries, ads, map motions…). Experiments (A/B) |
| Language translation; BLEU (Bilingual Evaluation Understudy) score : https://t.co/nzUtC9U5wa |
| generally, more data solves harder problems; i.e. predictive typing (which measures while it’s predicting) |
| Data is not enough. Experimentation is critical. Which X is faster? Does Y increase latency? Numerous methods for experiments. |
| Every time you enter a query into google, you’re part of an experiment. |
| Experiments need statisticians but at google they must be able to be “productionized” and done at scale.” |