By Jay Jacobs (@jayjacobs)
Sat 07 November 2015
|
tags:
blog,
statistics,
-- (permalink)
There is a lot of misperception around sample sizes and the confusion happens on both sides of the research. A common question when researchers are starting out is, “How big should my sample size be?.” To help with that, there are handy calculators all over the Internet. But the more troubling part of misunderstanding sample size happens when people consume research and attempt to dismiss it claiming the sample size is too small. To make matters worse, we are in the age of big data where millions of samples are the norm, and so seeing a study with “just” 500 samples seems easy to dismiss. But the data just don’t work that way and I wanted to provide some context around sample size and experimentation.
What’s a good sample size? How many samples should a study have? Unfortunately, the answer depends on how much confidence or accuracy the research needs and the size of the effect being measured. Additionally, these are generally balanced against the cost of additional data. It is impossible to look at any sample size and determine if it’s “statistically significant”. Let me repeat and rephrase that differently: You can never say a sample size is too small if you just know the sample size. And if the researcher is working with a convenience sample (where they take all the data you can get), they should include estimations of uncertainty in their inferences that account for the sample size, even if the sample isn’t small.
Small samples can easily detect large differences
Another way to say this, is that as the experimenter increases the number of samples, they are able to detect smaller and smaller differences. If an experimenter is looking at two things that are vastly different (such as perhaps opinions between “experts” and non-experts), the large difference should be obvious even with a small sample. However, if the experimenter is trying to compare two samples that are very similar (yet still different), it may take a larger sample to find that difference. These are factored into sample size calculations. As a thought experiment, imagine flipping a novelty coin that produced heads 90% of the time. How many flips would it take before you (even intuitively) raised an eyebrow on the difference between heads and tails? It’d be weird (that’s a technical term) if you flipped a coin ten times and only got one tails. Maybe you wouldn’t make any claims about the coin after ten flips, but as you continue to flip the coin, your confidence to say something is wrong would increase, right? And with a hugely unfair coin (that flips heads 90% of the time), it wouldn’t take too many flips before you are convinced. Sometimes, just a handful of samples is still enough to detect a difference.
Samples size dictates the amount of confidence in an estimate
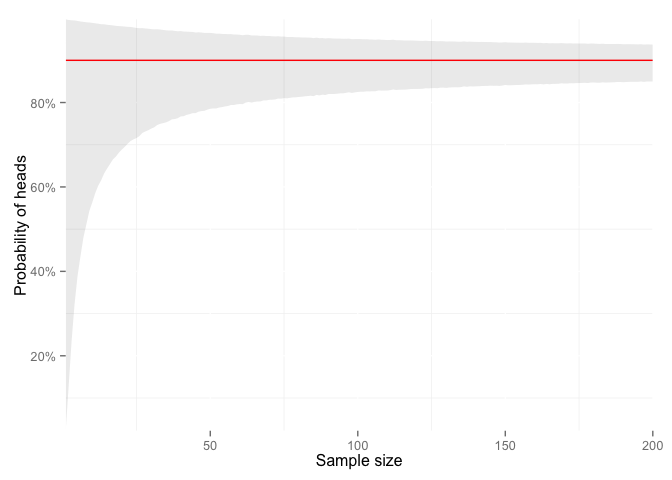
Let’s continue the coin flip thought experiment and say we don’t want test if it’s fair or not (we know it’s not). Instead, we want to estimate the probability of flipping a heads with this coin. Let’s say we flip it 10 times and get 9 heads, can we say the probability is 90%? Perhaps, but it’d be reckless. Because with a little math, we find that the actual probability of getting a heads could be anywhere between 55% and 99% given 9 heads out of 10 flips. If we doubled that to 20 flips and got 18 heads, we could still only say the range is still only 66% to 99%. We could even run a simulation and make a picture of what the number of flips does to the confidence we have in the estimate (with 90% probably of heads).

Look at the left side of that plot, look how our confidence increases rapidly as we add a few more samples. Then look at the rate of improvement between 100 and 200 samples. Statisticians refer to the amount of confidence in an experiment as the “power” of that experiment. Power is defined (in simple terms) as the “likelihood that a study will detect an effect when there is an effect there to be detected.”
Nobody turns down more data
Okay, there are cases where someone would turn down more data, but my point here is sample size is never limited with a casual decision. Collecting data has real costs associated with it. There are either direct costs (such as paying participants, salaries, etc.) or indirect costs of time and effort to gather and clean the data. At some point, it becomes infeasible (perhaps even impossible) to get more data. The cost of that data must be balanced with the benefit of more data. But keep in mind that the benefit of getting more data isn’t linear. To reduce the uncertainty (confidence interval) by half, the sample size must quadruple. So, if you collect 30 samples you can double your precision by adding 120 more samples, but if you are at 500 samples, you’d have to collect and clean 1,500 more samples to have the same proportional benefit in the effect.
Some points of reference
- R.A. Fisher, who developed the design of experiements and who’s techniques are used in most every modern experiment, designed his famous “Lady Tasting Tea” experiment with just 8 cups of tea.
- Anyone who’s researched risk analysis undoubtedly has come across Kahneman and Tversky’s Prospect theory. Their initial study pdf had a sample size of 95 students.
- Ivan Pavlov had 40 dogs (“Pavlov’s Dogs”) from which he developed his Classical Conditioning work.
- Asch’s conformity experiments, influential research on social and peer pressure, used 50 subjects.
