By Bob Rudis (@hrbrmstr)
Wed 27 August 2014
|
tags:
cartography,
maps,
mapping,
heatmap,
cartogram,
r,
rstats,
-- (permalink)
UPDATE The
statebinspackage is now available on CRAN
I became enamored (OK, obsessed) with a recent visualization by the WaPo team which @ryanpitts tweeted and dubbed statebins:
Statebins! RT @kevinschaul: States with the most jobs lost or threatened because of trade. https://t.co/r1pJhudpz3 pic.twitter.com/eMozAgyEAb
— Ryan Pitts (@ryanpitts) August 24, 2014In a very real sense they are heatmap-like cartograms (read more about cartograms in Monmonier’s & de Blij’s How to Lie With Maps). These statebins are more heat than map and convey quantitative and rough geographic information quickly without forcing someone to admit they couldn’t place AR, TN & KY properly if you offered them $5.00USD. Plus, they aren’t “boring” old bar charts for those folks who need something different and they take up less space than most traditional choropleths.
As @alexcpsec said in his talk at security summer camp:
"PLEASE STOP USING GLOBAL MAPS for visualizing IP-based threat data." - @alexcpsec #defcon
— Wendy Nather (@451wendy) August 8, 2014Despite some posts here and even a few mentions in our book, geographic maps have little value in information security. Bots are attracted to population centers as there are more people with computers (and, hence, more computers) in those places; IP geolocation data is still far from precise (as our “Potwin Effect” has shown multiple times); and, the current state of attacker origin attribution involves far more shamanism than statistics.
Yet, there can be some infosec use cases for looking at data through the lens of a map, especially since “Even before you understand them, your brain is drawn to maps.”. To that end, while you could examine the WaPo javascript to create your own statebin visualizations, I put together a small statebins package that lets you create these cartogram heatmaps in R with little-to-no effort.
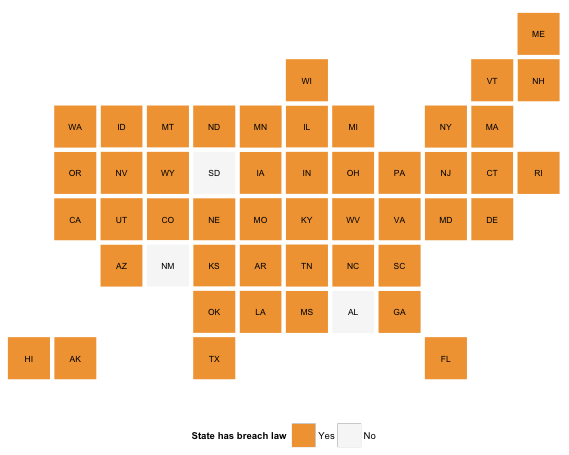
Let’s look at one potential example: data breaches; specifically, which states have breach notification laws. Now, I can simply tell you that Alabama, New Mexio and South Dakota have no breach notification laws, but this:

took just 4 lines of code to produce:
library(statebins)
dat <- data.frame(state=state.abb, value=0, stringsAsFactors=FALSE)
dat[dat$state %in% c("AL", "NM", "SD"),]$value <- 1
statebins(dat, breaks=2, labels=c("Yes", "No"), brewer_pal="PuOr",
          text_color="black", font_size=3,
          legend_title="State has breach law", legend_position="bottom")
and makes those three states look more like the slackers they are than the sentence above conveyed.
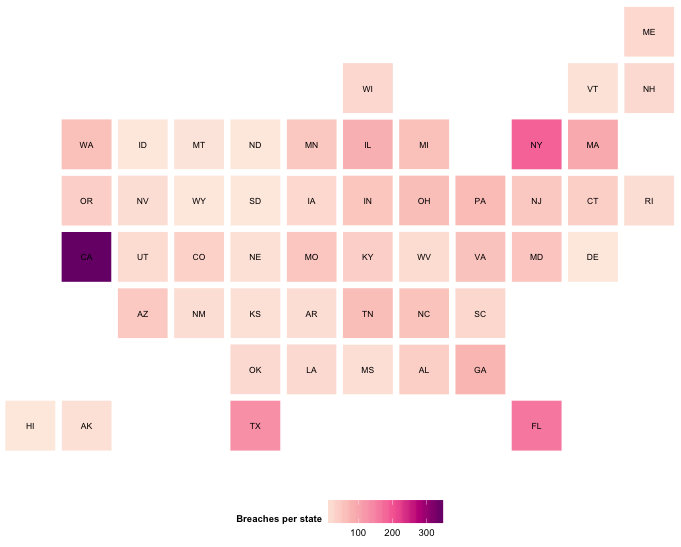
We can move to a less kitschy use case and chart out # of breaches-per-state from the venerable VCDB:

library(data.table)
library(verisr)
library(dplyr)
library(statebins)

vcdb <- json2veris("VCDB/data/json/")

# toss in some spiffy dplyr action for good measure
# and to show statebins functions work with dplyr idioms

tbl_dt(vcdb) %>%
  filter(victim.state %in% state.abb) %>%
  group_by(victim.state) %>%
  summarize(count=n()) %>%
  select(state=victim.state, value=count) %>%
  statebins_continuous(legend_position="bottom", legend_title="Breaches per state",
                       brewer_pal="RdPu", text_color="black", font_size=3)
The VCDB is extensive, but not exhaustive (signup to help improve the corpus!) and U.S. organizations and state attorneys general are better than it would seem about keeping breaches quiet. It’s clear there are more public breach reports coming out of California than other states, but why is a highly nuanced question, so be careful when making any geographic inferences from it or any public breach database.
There are far more uses for statebins outside of information security, and it only takes a few lines of code to give it a whirl, so take it for a spin the next time you have some state-related data to convey. You can submit any issuses, feature- or pull requests to the github repo as I’ll be making occassional updates to the package (which may make it to CRAN this time, too).
Tweet