By Bob Rudis (@hrbrmstr)
Tue 14 July 2015
|
tags:
blog,
r,
rstats,
time series,
r101,
-- (permalink)
We were asked a question on how to (in R) aggregate quarterly data from what I believe was a daily time series. This is a pretty common task and there are many ways to do this in R, but we’ll focus on one method using the zoo and dplyr packages. Let’t get those imports out of the way:
library(dplyr)
library(zoo)
library(ggplot2)
Now, we need some data. This could be from a database, log file or even Excel spreadsheet or CSV. Since we’re focusing on the aggregation and not the parsing, let’s generate some data, for daily failed logins in calendar year 2014:
set.seed(1492)

yr_2014 <- seq(from=as.Date("2014-01-01"),
                              to=as.Date("2014-12-31"),
                              by="day")

logins <- data_frame(date=yr_2014,
                     failures=round(rlnorm(length(yr_2014)) *
                                      sample(10:50, 1)), 0.5, 3)

glimpse(logins)

## Observations: 365
## Variables:
## $ date     (date) 2014-01-01, 2014-01-02, 2014-01-03, 2014-01-04, 2014...
## $ failures (dbl) 18, 13, 6, 91, 24, 46, 14, 34, 10, 48, 45, 11, 8, 40,...
## $ 0.5      (dbl) 0.5, 0.5, 0.5, 0.5, 0.5, 0.5, 0.5, 0.5, 0.5, 0.5, 0.5...
## $ 3        (dbl) 3, 3, 3, 3, 3, 3, 3, 3, 3, 3, 3, 3, 3, 3, 3, 3, 3, 3,...
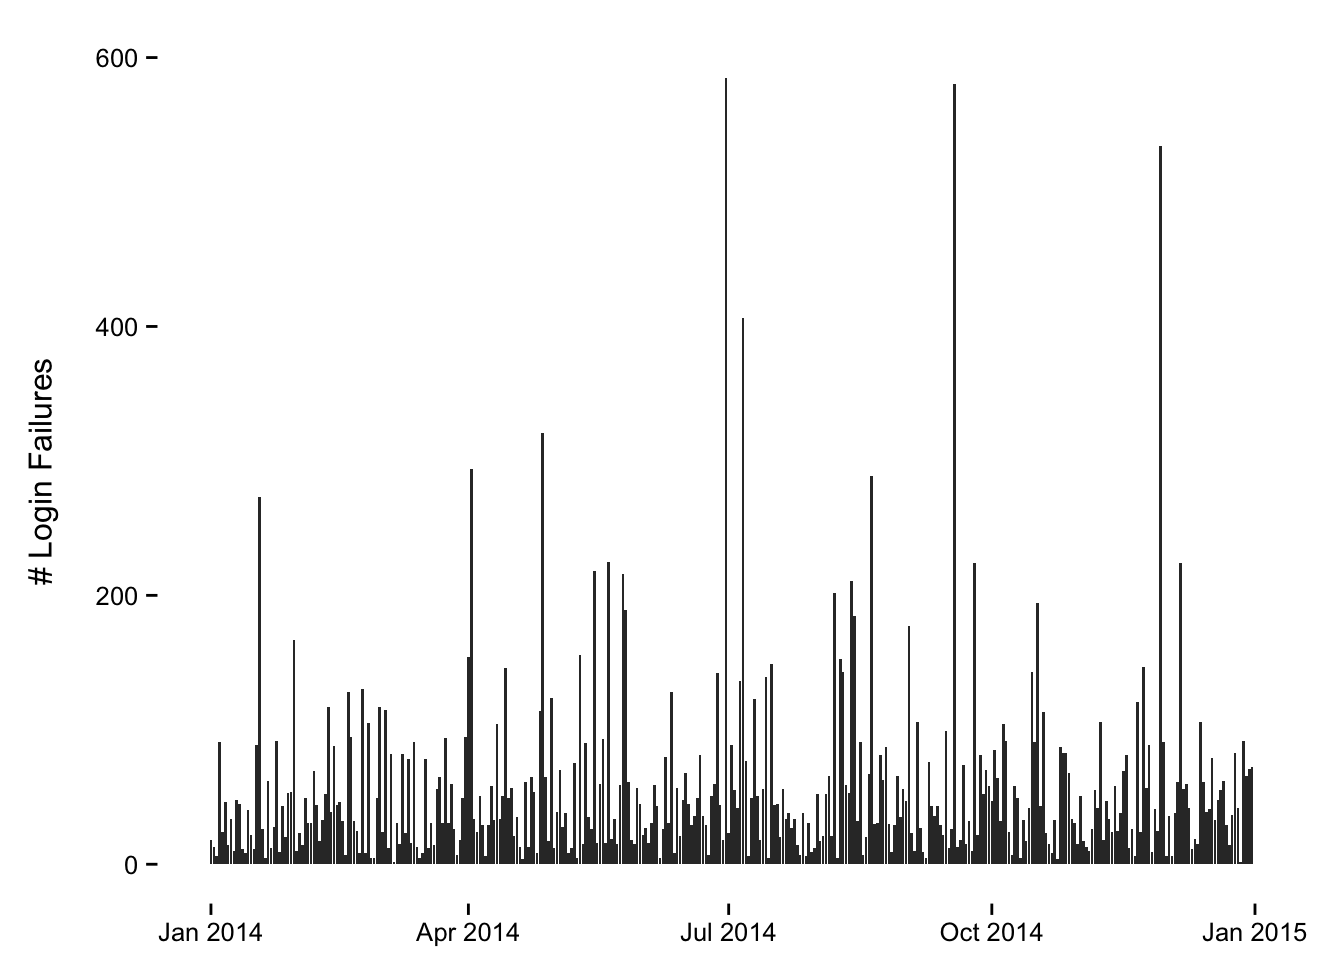
Using set.seed makes the pseudo-random draws via rlnorm repeatable on other systems. We can get a better look at that data:
ggplot(logins, aes(x=date, y=failures)) +
  geom_bar(stat="identity") +
  labs(x=NULL, y="# Login Failures\n") +
  theme_bw() +
  theme(panel.grid=element_blank()) +
  theme(panel.border=element_blank())
We can then, summarize the number of failed logins by quarter using as.yearqtr:
logins %>%
  mutate(qtr=as.yearqtr(date)) %>%
  count(qtr, wt=failures) -> total_failed_logins_by_qtr

total_failed_logins_by_qtr

## Source: local data frame [4 x 2]
##
##       qtr    n
## 1 2014 Q1 4091
## 2 2014 Q2 5915
## 3 2014 Q3 6141
## 4 2014 Q4 5229
NOTE: you can control the way those quarter labels look with the format parater to as.yearqtr:
formatcharacter string specifying format.
"%C","%Y","%y"and"%q", if present, are replaced with the century, year, last two digits of the year, and quarter (i.e. a number between 1 and 4), respectively.
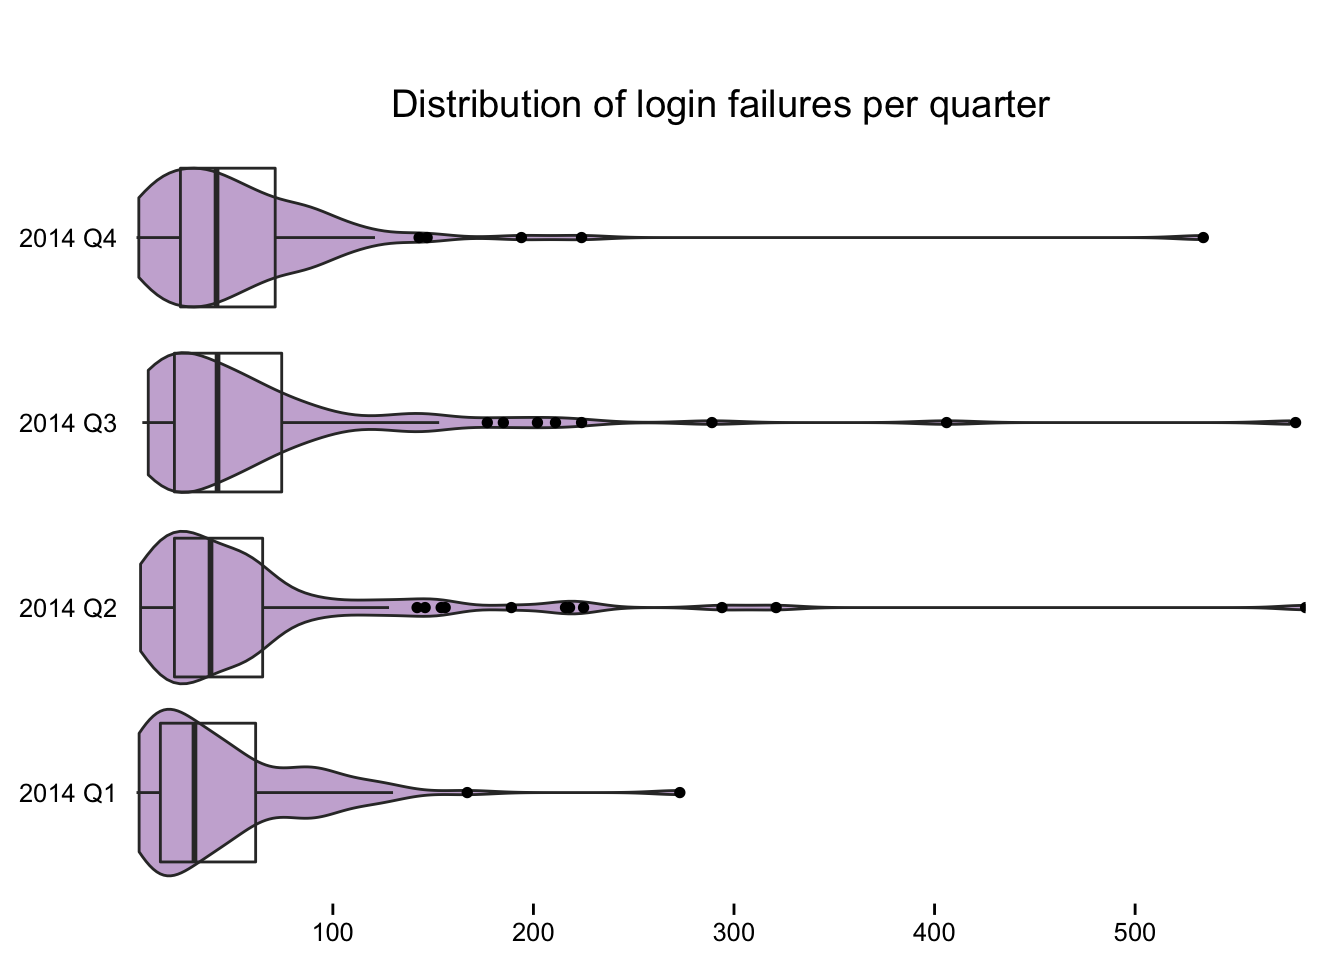
But you can also get more intra-quarter detail as well by looking at the distribution of failed logins:
logins %>%
  mutate(qtr=as.character(as.yearqtr(date))) %>%
  ggplot() +
  geom_violin(aes(x=qtr, y=failures), fill="#cab2d6") +
  geom_boxplot(aes(x=qtr, y=failures), alpha=0) +
  scale_y_continuous(expand=c(0, 0)) +
  labs(x=NULL, y=NULL, title="\nDistribution of login failures per quarter") +
  coord_flip() +
  theme_bw() +
  theme(panel.grid=element_blank()) +
  theme(panel.border=element_blank()) +
  theme(axis.ticks.y=element_blank())